CRITICAL READING TRAINING
著者の主張を論理的に読み解くには,主張を支えている根拠との関係性が大切です。今回は根拠としてグラフからデータを読み取り,主張とデータとの因果関係を考え,推論します。今までに学んだスキルを総動員して,しっかり支持できる根拠をもって読み解きましょう。
The following passage is Takanobu’s observations on the PISA(Programme for International Student Assessment)survey results. Read the passage and answer the questions.

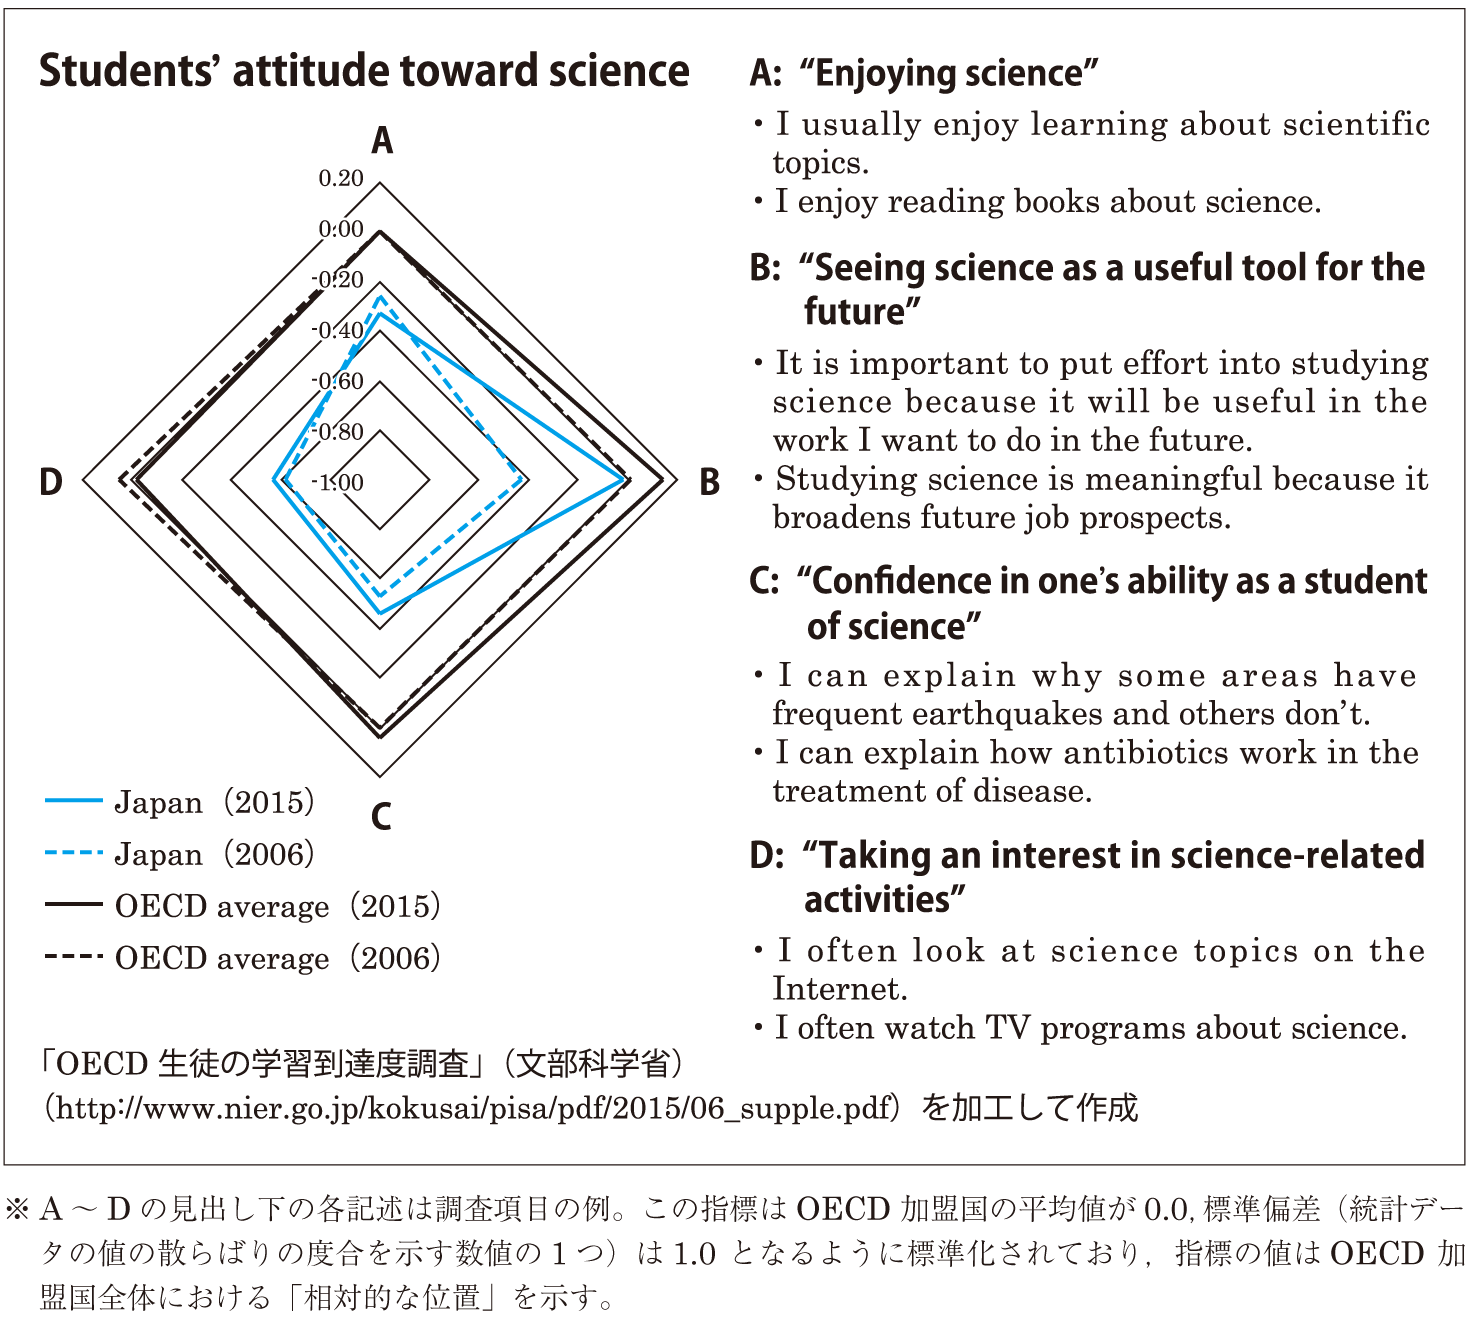
The graph shows four ways in which students’ interest in science developed in Japan and in OECD countries between the years 2006 and 2015. These are “Enjoying science”, “Seeing science as a useful tool for the future”, “Confidence in one’s ability as a student of science” and “Taking an interest in science-related activities”.
As you can see, Japan’s scores in all areas are lower than the OECD average. However, Japan’s score in the second area, “seeing science as a useful tool for the future” has increased in the last ten years. As the job market has become more severe, Japanese students have become aware of the importance of getting a good job and because of this, more students want to study a subject that will help them in the future. This score is still lower than the OECD average, however.
In order to improve these low scores, it is important for students not only to know science is a useful tool but also to experience how it helps their lives and understand how they use it in their lives. So, education has to change. We need more enjoyable and understandable teaching at school and media that deals with science.
Understanding Fact & Opinion(意見を適切なデータでサポートする問題)
(1) The underlined part can’t be read from the graph, and you can’t judge whether it is fact. Takanobu collected the following data; which cannot be used to support the claim made in the underlined sentence?
- Change in the number of universities
- First-choice college department rankings
- Job-opening-to-application ratio
- Popular occupation rankings
Inference(結果として予想される1文を考える問題)
(2) Choose from below the statement which is inferred in the passage.
- For Takanobu, Japanese science education is not enjoyable.
- Knowing about science is the basis of our lives.
- The OECD average is the standard for world education.
Reading Graphs Logically(思い込みに捉われず,グラフを正確に読み取る問題)
(3) Choose from the statements below the one that can be read from the graph.
- Ability in science is fairly low in the OECD countries.
- Science education in Japan has not been successful at all.
- The results shown in the graph are basically based on studentsʼ opinions.

- PISA
- meaningful
- broaden(s)
- prospect(s)
- frequent
- antibiotic(s)
- treatment
- related
- OECD
- job market
- education
- media
- department
- ranking(s)
- job-opening-to-application ratio
- occupation
- fairly
